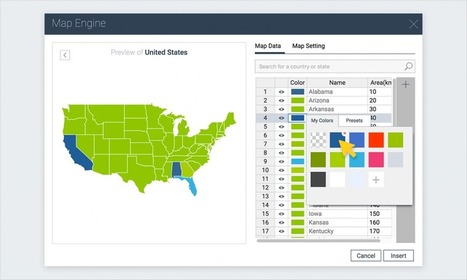

A step-by-step tutorial on how to create an interactive map with Visme, a free online infographic and presentation tool.
Get Started for FREE
Sign up with Facebook Sign up with X
I don't have a Facebook or a X account


 Your new post is loading...
 Your new post is loading...
Your new post is loading...
A step-by-step tutorial on how to create an interactive map with Visme, a free online infographic and presentation tool. 

Tom Cockburn's curator insight,
December 13, 2016 3:55 AM
Create your own maps

António Leça Domingues's curator insight,
December 19, 2016 6:44 AM
Criar um mapa interativo com Visme.

Bart van Maanen's curator insight,
December 19, 2016 10:02 AM
Mooie tool om een kaart van data te voorzien.
Sign up to comment

Ryan McDonough's curator insight,
July 7, 2014 8:19 AM
Self explanatory visual on the benefits of gaming as a means of learning. Outlined are the rewards, mastery, engagement, intensity, exercise, readiness, and competitiveness. These types of graphics need to be displayed in the classroom. There's always parents who are unsure of how gaming qualifies as teaching. Can't they just sit their kid in front of an iPad all day at home? Well, in the appropriate setting, with the right direction and guidance, games are certainly good for learning. Some people just don't know that from experience yet. |
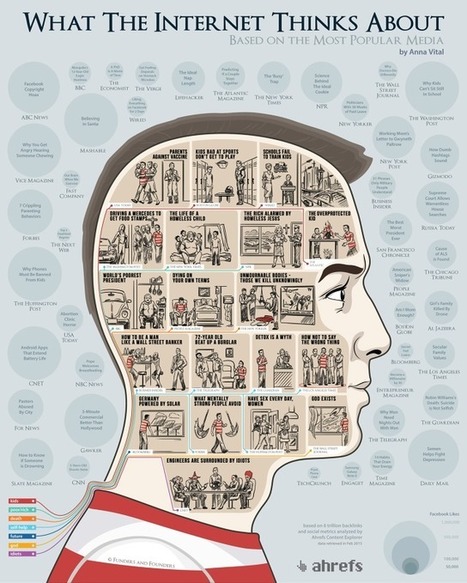
What does the Internet care about? What articles do we share the most? Using the data from the Ahrefs Content Explorer, the people at Funders and Founders Via Lauren Moss

Emilio Ruano's curator insight,
May 4, 2015 1:17 PM
At least, the concern about equality, energy and social welfare is there. I like the last one about engineers tho. Hahaha. 
Mackenzie Hamilton's curator insight,
October 13, 2015 8:36 AM
I think this article is awesome because they use data visualization to show what people share the most, visit the most, and search the most. Data is everywhere and people are using it everyday and sometimes don't even think about it. |